
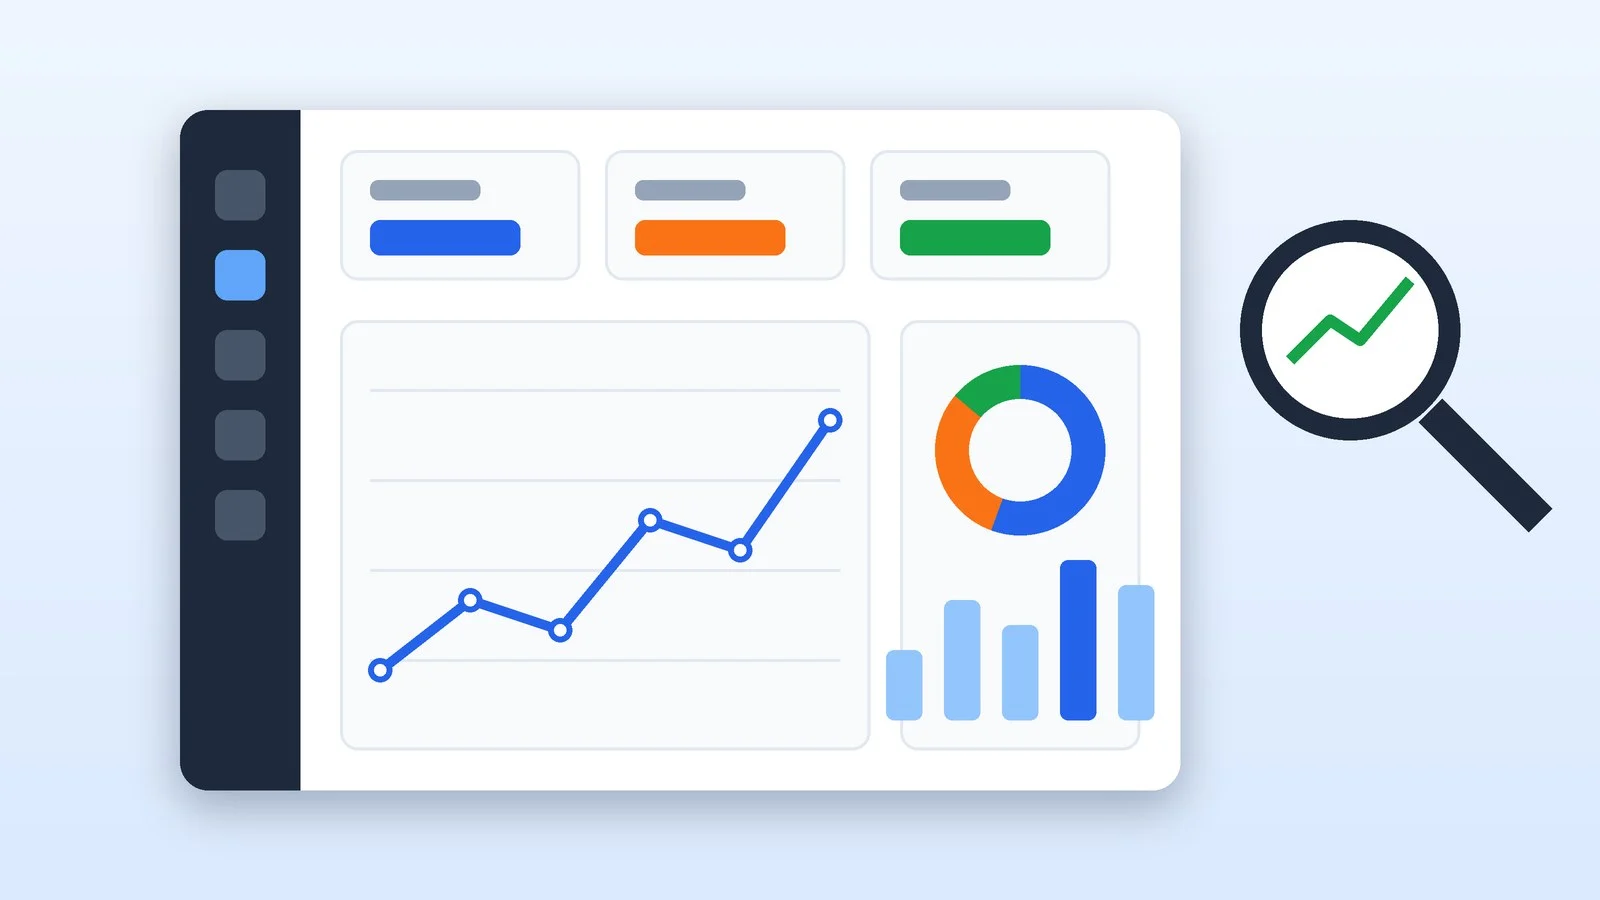
To start using Google Analytics, create a GA4 account and property, add a web data stream, install the Google tag on your pages, and make sure your visits show up in the Realtime report. Then mark key events such as leads, calls, and purchases, extend data retention, and link Analytics to Search Console.
Today, Google Analytics means GA4. Universal Analytics, with its old “goals” and UA- tracking code, is gone: standard UA properties stopped processing data on July 1, 2023, and starting the week of July 1, 2024, Google shut off access to all UA properties, including paid 360 ones, and is deleting their data. The setup below follows Google’s help pages as of October 6, 2026.
How GA4 is organized: account, property, and data stream
An account represents a company or owner and can hold up to 2,000 properties. A property is a set of reports with its own time zone and currency, usually one per website or per website plus app. A data stream is a source of events for the property: a website, an Android app, or an iOS app, with up to 50 streams per property.
Account
Company or owner, up to 2,000 properties
Property
Site reports, time zone, and currency
Data stream
Website or app, G- ID
Google tag
Code on your pages sends events
Everything in GA4 is built on events: a page view, a scroll, a click, a form submission. You mark the events that matter to your business as key events. Since March 27, 2024, that is Google’s name for what used to be conversions in Analytics, while “conversions” now means actions used to measure ad performance in Google Ads.
Create an account and a property
- Go to analytics.google.com and sign in with your Google Account.
- In Admin, click Create → Account, enter an account name, and configure the data-sharing settings, which control what data you share with Google.
- Click Next, name the property, and select the reporting time zone and currency.
- Select your industry category and business size, then choose how you intend to use Google Analytics.
- Click Create and accept the Analytics Terms of Service and the Data Processing Amendment.
The time zone sets the day boundaries in your reports, and changing it only affects data going forward, so pick yours right away. At the business objectives step, choose Get baseline reports if you want the Life cycle collection in the menu, which this guide follows. Other options replace it with the Business objectives collection, where reports are picked and grouped around the goals you chose.
Result: Your GA4 property exists, and you can add a data stream.
Add a web data stream
- In Admin, under Data collection and modification, click Data streams → Add stream → Web.
- Enter the URL of your primary website, such as example.com, and a stream name.
- Leave Enhanced measurement turned on and click Create stream.
The URL field takes your site’s main domain name. Once the stream is created, Stream details opens: copy the ID that starts with G-. In the same place, under Google tag, the View tag instructions button shows the ready-made code for your site.
Result: Stream details shows an ID like G-XXXXXXXXXX.
Connect Google Analytics to your website
Pick one of three methods. Google lists having both the Google tag and Tag Manager installed at the same time as one of the reasons a setup goes wrong.
| Method | Best for | What to do |
|---|---|---|
| Field in your CMS or site builder | WordPress, Wix, Shopify, and more | Paste the G- ID |
| Google tag code (gtag.js) | You can edit the site’s HTML | Paste the code after <head> |
| Google Tag Manager | Tags for many services in one place | Add a Google tag to the container |
With a CMS or site builder
Many content management systems only need the G- ID. Google keeps instructions for WordPress (the Site Kit and MonsterInsights plugins), WooCommerce, Shopify, Wix, Squarespace, Drupal, Blogger, and others. If there’s no field for it, paste the whole tag using your CMS’s custom HTML feature.
Manually, with gtag.js
Under View tag instructions, copy the entire snippet — from the Google tag (gtag.js) comment to the closing script tag — and paste it immediately after <head> on every page. Analytics doesn’t collect data from pages without the code.
With Google Tag Manager
- At tagmanager.google.com, create an account and a Web container.
- Add the two container snippets to your site: the first as high in <head> as possible, the second right after the opening <body> tag.
- Go to Tags → New, under Choose tag type select Google Tag, and enter the same G- ID as the Tag ID.
- In the Triggering section, select Initialization – All Initialization Events and click Save.
- Test the tag in Preview mode, then publish a container version: changes don’t go live until you publish.
Result: The Google tag loads on every page of your site.
Check that data is coming in
Data collection begins within 30 minutes. Open your site in another tab and click through a few pages, then in Analytics click Reports and open Realtime: it shows active users in the last 5 and 30 minutes, the pages they view, and their events.
For a closer look, open tagassistant.google.com or Preview in Tag Manager, enter your site’s URL, and click Connect. Tag Assistant shows which tags fired and in what order, and it turns on debug mode, so your events appear under Admin → Data display → DebugView.
Result: Your visit shows up in the Realtime report, and your events appear in DebugView.
Set up enhanced measurement and filter out your traffic
Enhanced measurement collects events without code changes. In the stream settings, you can turn off any option you don’t need except page views:
- Scrolls — a visitor first sees 90% of the page height;
- Outbound clicks — clicks on links to other domains;
- Site search — results pages with q, s, search, query, or keyword parameters in the URL;
- Video engagement — embedded YouTube videos;
- File downloads — links to PDFs, documents, spreadsheets, archives, video, and audio;
- Form interactions — starting and submitting a form.
Exclude your own visits with a filter. In Data streams, open the stream → Configure tag settings → Show more → Define internal traffic, and add your office or home IP addresses. Then go to Data collection and modification → Data filters, create an internal traffic filter set to Exclude, and leave it in the Testing state first. A filter takes 24–36 hours to apply.
Result: Automatic events are collected, and visits from your office are marked as internal.
Mark your key events
A key event is an action that matters to your business: a lead, a call, a purchase. You need the Marketer role or higher to mark one. A standard property allows up to 30 key events, and purchase is marked automatically.
If the event is already coming in, go to Admin → Data display → Events and click the star next to it. You can also do it in the Events report: the three-dot icon → Mark as key event. Marking doesn’t change past data, and the event shows up in standard reports within 24 hours.
For leads, a thank-you page often works. You can’t mark page_view itself — every page view would count. Instead, click + Create event, enter a name such as thank_you, select Create without code, and set the condition: the page_view event with your thank-you page URL. If the action isn’t among your events, a developer can add it in JavaScript below the Google tag:
gtag('event', 'generate_lead');Result: Leads, calls, or purchases count as key events.
Extend data retention
By default, a property keeps user-level and event-level data for 2 months. Standard reports aren’t affected, but older data disappears from Explorations. Go to Admin → Data collection and modification → Data retention and choose 14 months, the maximum for a free property. The new setting takes effect after 24 hours.
Result: Explorations show 14 months of data instead of 2.
Link Search Console and Google Ads
Linking Search Console adds the Google Organic Search Queries and Google Organic Search Traffic reports. You need the Editor role on the Analytics property and verified owner access to the site in Search Console.
- In Admin, under Product links, click Search Console links → Link.
- Choose your Search Console property, then your site’s web stream.
- Review the settings and submit.
A web stream can be linked to only one Search Console property. The Search Console report collection is unpublished by default: find it in Library at the bottom of the left menu and publish it. Data arrives with a 48-hour delay and covers up to 16 months.
Site not verified in Search Console yet? The gtag.js code you already installed will do: choose the Google Analytics verification method, using the same Google Account and edit access in Analytics. If your tag runs through Tag Manager, there’s a separate Google Tag Manager verification method.
For ads, open Google Ads links and click Link. You need the Editor or Administrator role in Analytics and administrative access in Google Ads. Personalized advertising is on by default when you link, and you can later create conversions from key events for bidding.
Result: Analytics shows your Google Search queries, and Google Ads receives your key events.
Which Google Analytics 4 reports to open first
All reports live under Reports in the left menu. The names below follow the Life cycle collection; in the Business objectives collection, many of these reports sit in goal-based topics.
Realtime report
It covers the last 30 minutes: how many people are on the site, where they came from, which pages they view, and which events they trigger. It’s handy for checking a newsletter or social post launch. Attribution here is limited, so check traffic sources in the Acquisition reports.
Where visitors come from
Reports → Acquisition → Traffic acquisition shows where sessions from new and returning visitors begin. Rows are channel groups: Organic Search (including Google’s AI Overviews and AI Mode), Direct, Referral for links from other sites, and Organic Social.
Since May 2026, there’s an AI Assistant channel for visits from ChatGPT, Gemini, Deepseek, Copilot, Grok, and similar services. The User acquisition report in the same section shows where new users first came from. Google advises against comparing its numbers with Traffic acquisition: the two reports have different scopes.
Pages and events
The Engagement section shows what people do on your site. Pages and screens gives views and users per page, Landing page shows which pages visits start on, and Events shows how many times each event fired. Your home page appears in reports as the path “/”.
Explorations and dashboards
When standard reports aren’t enough, click Explore in the left menu. Three techniques cover most beginner needs: Free-form exploration for a table or chart by any dimension, Funnel exploration for the step where visitors drop off on the way to a lead, and Path exploration for where people go after a given page.
You add dimensions and metrics in the Variables panel and drag them into Tab Settings. If a query covers more than 10 million events, the exploration is based on sampled data. Since September 2026, you can also put your key numbers on one screen: Reports → + Create → Dashboard, with up to 15 cards in a standard property.
What users, sessions, and engagement mean
- Users — how reports show active users: people who had an engaged session, a first visit to the site, or recorded engagement time.
- New users — people who visited the site for the first time (the first_visit event).
- Sessions — a session starts when a visitor opens a page with no active session and ends after 30 minutes of inactivity; there’s no limit to how long it can last.
- Engaged sessions — sessions longer than 10 seconds, with a key event, or with two or more page views.
- Engagement rate — the share of engaged sessions, while Bounce rate is the share of sessions that weren’t engaged. A one-page visit longer than 10 seconds isn’t a bounce.
- Average engagement time — how long the site was the active browser tab, averaged per active user.
- Views — page views, including repeat views.
Most reports don’t include engagement rate and bounce rate by default. An Editor or Administrator can add them with Customize report → Metrics.
Cheat sheet: task, report, and metrics
| Task | Where in GA4 | What to look at |
|---|---|---|
| Check that the tag works | Realtime report, DebugView | Users in last 30 minutes, events |
| See where people come from | Acquisition → Traffic acquisition | Sessions by channel group |
| Gauge traffic from ChatGPT and other AI | Traffic acquisition | AI Assistant channel |
| Find popular pages | Engagement → Pages and screens | Views, users |
| See where visits start | Engagement → Landing page | Sessions, key events |
| Count leads and purchases | Engagement → Events | Key events |
| See Google Search queries | Search Console reports | Clicks, impressions, CTR, position |
| Find where customers drop off | Explore → Funnel exploration | The step where visitors leave |
Cookie consent and data protection
If people from the European Economic Area (EEA) visit your site, Google requires you to collect their consent to use personal data and send consent signals — a condition for continuing to use measurement, ad personalization, and remarketing for them. Consent mode handles this technically: the banner passes on the visitor’s choice, and Google tags adjust their behavior.
The easiest route is a banner from a consent management platform (CMP) on Google’s partner list — it includes Cookiebot, CookieYes, Complianz, OneTrust, Usercentrics, and others — with consent mode turned on. For a custom banner, a developer uses consent commands in gtag.js; ad-related signals require consent mode v2 with the ad_user_data and ad_personalization parameters.
In basic mode, tags are blocked until consent, so there’s no data on visitors who decline. In advanced mode, tags load right away and send cookieless pings when consent is denied, which Analytics uses to model behavior and conversions. Signal status is shown under Admin → Data collection and modification → Consent settings.
To see the banner the way a new visitor does, clear the site’s cookies in your browser. Google reminds site owners that they are responsible for complying with privacy laws and recommends checking the setup with a lawyer.
GA4 doesn’t log or store IP addresses, so the old IP masking setting isn’t needed. For visitors from the EU, Switzerland, and the UK, the IP address is used only to derive approximate location and is then discarded. Under Data collection, you can turn off Google signals and granular location and device data collection by region.
If data doesn’t show up
- The Realtime report is empty — click around the site yourself and wait about a minute. If it’s still empty, view the page source: the Google tag should sit right after <head> on every page.
- The ID doesn’t match — compare the G- ID in Stream details with the code on your site or in your CMS; extra spaces or characters in the code also break collection.
- Tag Manager sends nothing — check that the Google tag exists, has a trigger, and that the container version is published.
- Only old UA- code is on the site — Universal Analytics no longer accepts data, so install the Google tag with a G- ID.
- You just installed Analytics — Google allows up to 24 hours before data shows up, even in the Realtime report.
- Visitors decline cookies — in basic consent mode, their visits don’t reach your reports. Check Consent settings.
- The menu has no Acquisition or Engagement — the property uses the Business objectives collection. An Editor or Administrator can add Life cycle through Library.
- No Search Console reports — publish their collection in Library; the first data appears after 48 hours.
Sources and methodology
Analysis of public sourcesChecked 6 October 2026
- Google Analytics Help — Set up Analytics for a website and/or app support.google.com
- Google Analytics Help — Google Analytics 4 has replaced Universal Analytics support.google.com
- Google Analytics Help — Mark events as key events support.google.com
- Tag Manager Help — Set up Google Analytics in Tag Manager support.google.com
- Google Analytics Help — Consent mode on websites and mobile apps support.google.com
FAQ
Is Google Analytics 4 free?
Yes, standard Google Analytics is free. The paid Google Analytics 360 has higher limits — for example, up to 50 key events instead of 30 and event data retention of up to 50 months.
Can I move my Universal Analytics data to GA4?
No. Starting the week of July 1, 2024, Google shut off access to Universal Analytics properties and is deleting their data unless it was exported in advance. GA4 collects data from the moment the tag is installed.
How long until data appears after installing the tag?
Collection begins within 30 minutes, which you can see in the Realtime report. For a brand-new installation, Google allows a delay of up to 24 hours, and standard reports take 24–48 hours to process.
Do I need a cookie banner if my site operates in Ukraine?
Google’s requirement applies to visitors from the European Economic Area: if they visit your site, measurement and ad features are limited for them without their consent. Google doesn’t describe local personal data laws, so check those with a lawyer.
How do I give a developer or agency access to GA4?
In Admin, open Access Management at the account or property level, click + → Add users, and enter their Google Account email and a role. Viewer or Analyst is enough for reports, while setup work needs the Editor role; only an Administrator can add users.









Leave a Reply